
One year ago today I published an analysis of our first year with home photovoltaic panels.
This is a summary of year two.
To recap…
You can find all my prior solar power posts under the solar power tag.
My system is 31 405W REC Alpha-Pure 405W panels mounted on my roof with a SolarEdge inverter system. Its installation was completed, and it was connected to the grid, on September 22, 2022.
The technology’s advanced in two years and my panels aren’t sold anymore!
I have 1:1 net metering with an annual balance clear every March 31. We are projected to generate less energy than our annual use, so the annual clearing is not an issue.
We dry our clothes on an outdoor clothesline when we can. We had a major kitchen remodel this year, which included two more electric appliances and the swapping o f an electric oven and cook-top for an old natural gas range. So our usage patterns were in flux for most of the past year. They stabilized as of one month ago.
Costs
Its installation cost, net of Federal tax incentives, was $28,103.
Maintenance costs: Zero.
Cleaning costs: Zero. I sometimes noticed dust on the panels as well as the occasional bird dropping. All of them are on an incline, so I counted on rain showers to clean them off. Which they did.
Energy production
Total energy production over the past 365 days: 11.13 MWh.
In year one they produced: 12.5 MWh.
So the energy production declined by 11.0%
My next-door neighbor noticed a lower energy generation for their solar panels this year, too. Since my panels are quality products and I didn’t notice any system problems, I’m choosing to attribute this almost entirely to cloudier and/or more rainy weather.
Here’s the energy production by month and by quarter.

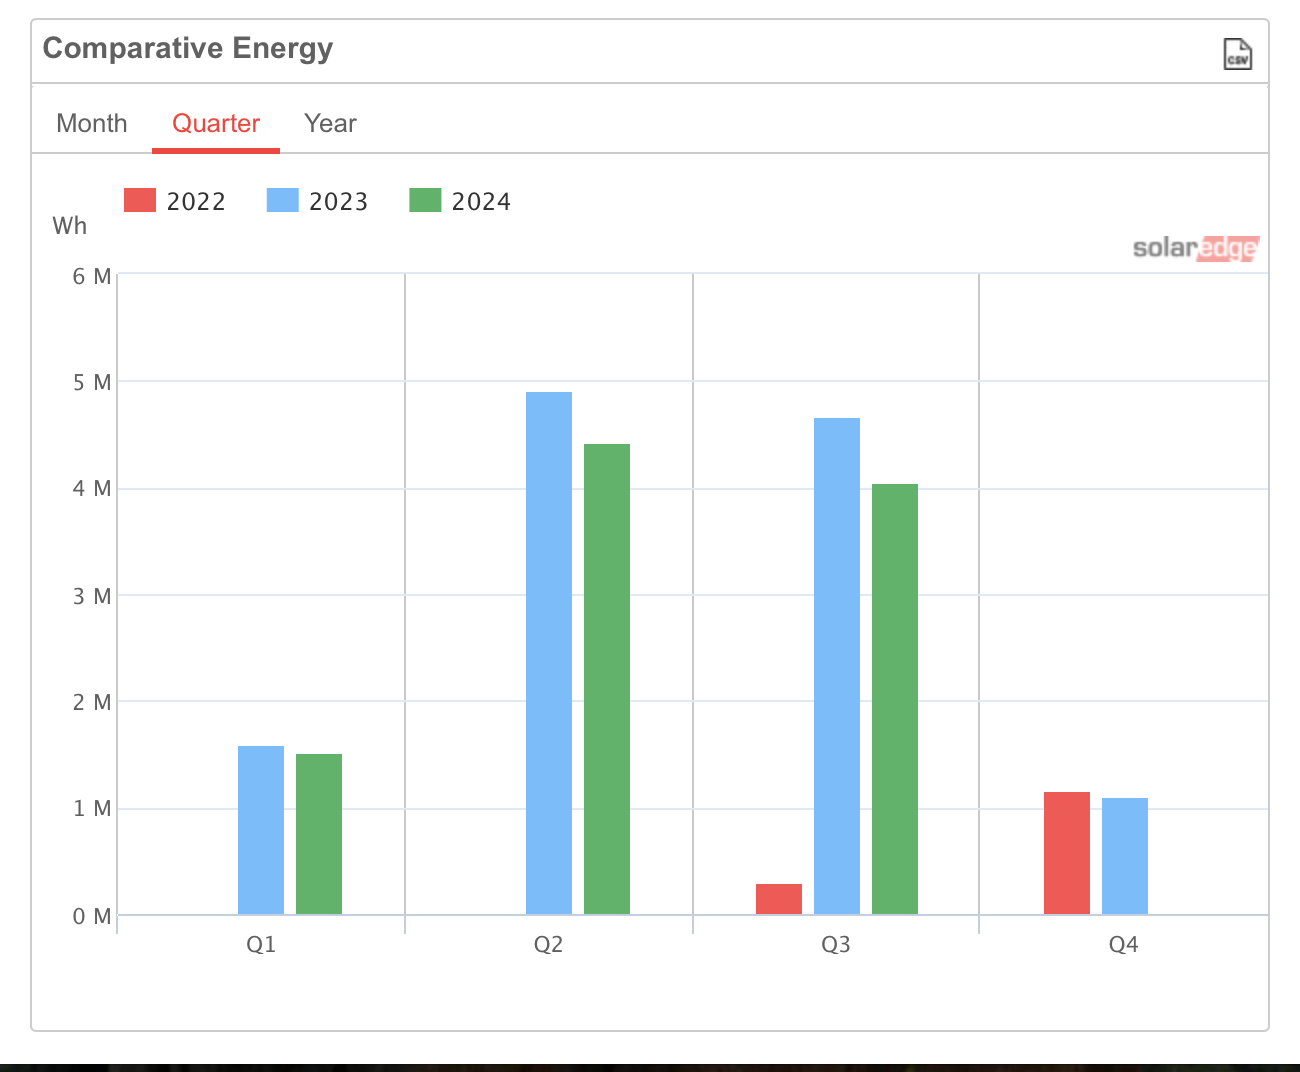
SolarEdge doesn’t provide a “past N days” graph, so you have to do some mental gymnastics. My production starts at the first red column in September, goes to the end of the graph on the right, wraps around to the left side of the graph in January 2023, and then ends in September 2023.
Just as in year one, July was my high production month.
Financial analysis
Electric bill reduction
My average cost in the past 365 days was $0.135/kWh. That’s my estimate from the bills. The SolarEdge server says my system generated 11.13 MWh. Some of that offset my current electric bills and some was banked for future savings as part of 1:1 net metering.
If I count the value of the banked kWh, which will help offset my next one or two electric bills, then it generated $1,472 in savings over the past year. I think this is correct because the offset savings will occur soon and I’ll be careful to not double-count it next year.
Year one savings was $1,600. Year two savings was $1,472. The savings reduction was less than the energy production reduction because the cost of Seattle City Light power increased by about 5% in year two.
ROI
I invested $28,103, net of the tax incentive, and I got back ($1,600 + $1,472) in savings over two years. That’s a 10.9% total ROI to date.
That’s 10.9% tax-free with zero fees and very low risk.
So from an ROI perspective this system is a win. And because of the likely increase in savings with each passing year, the effective rate of return will increase with each year. Still tax-free and very low risk.

One thought on “Learnings from home solar power, year 2”