
Two years ago today I published an analysis of our first year with home photovoltaic panels. And then I published an analysis of year two.
This is a summary of year three.
You can find all of my prior solar power posts under the solar power tag.
To recap…
My system has 31 405W REC Alpha-Pure panels roof-mounted with a SolarEdge inverter system. Its installation was completed, and it was connected to the grid, on September 22, 2022.
I have 1:1 net metering with an annual balance clear every March 31. Each year we generate less energy than our annual use, so the annual clearing isn’t an issue.
We dry our clothes on an outdoor clothesline when the weather allows.
Costs
Its installation cost, net of Federal tax incentives, was $28,103.
Maintenance costs: Zero.
Cleaning costs: $465. I had them professionally cleaned in May. The panels had sticky pollen-gunk that rainfall wasn’t washing off.
Energy production
There’s a skew between the production values reported by the SolarEdge monitoring site, SolarEdge phone app, and my inverter’s display. In the past two years I adjusted the numbers so I could correlate my spreadsheet to the reported SolarEdge reporting. This is becoming a chore.
I’m switching to use only the numbers reported directly by my inverter. As a result, these production values won’t match my blog posts for years 1 and 2 but they are internally consistent.
In year one, the photovoltaics produced 12.0 MWh.
In year two, they produced 10.90 MWh, which was 91% of year one’s production.
This year they produced: 11.26 MWh, which was 94% of year one’s production. Note that I had them cleaned this year.
Here’s the energy production by month and by quarter.

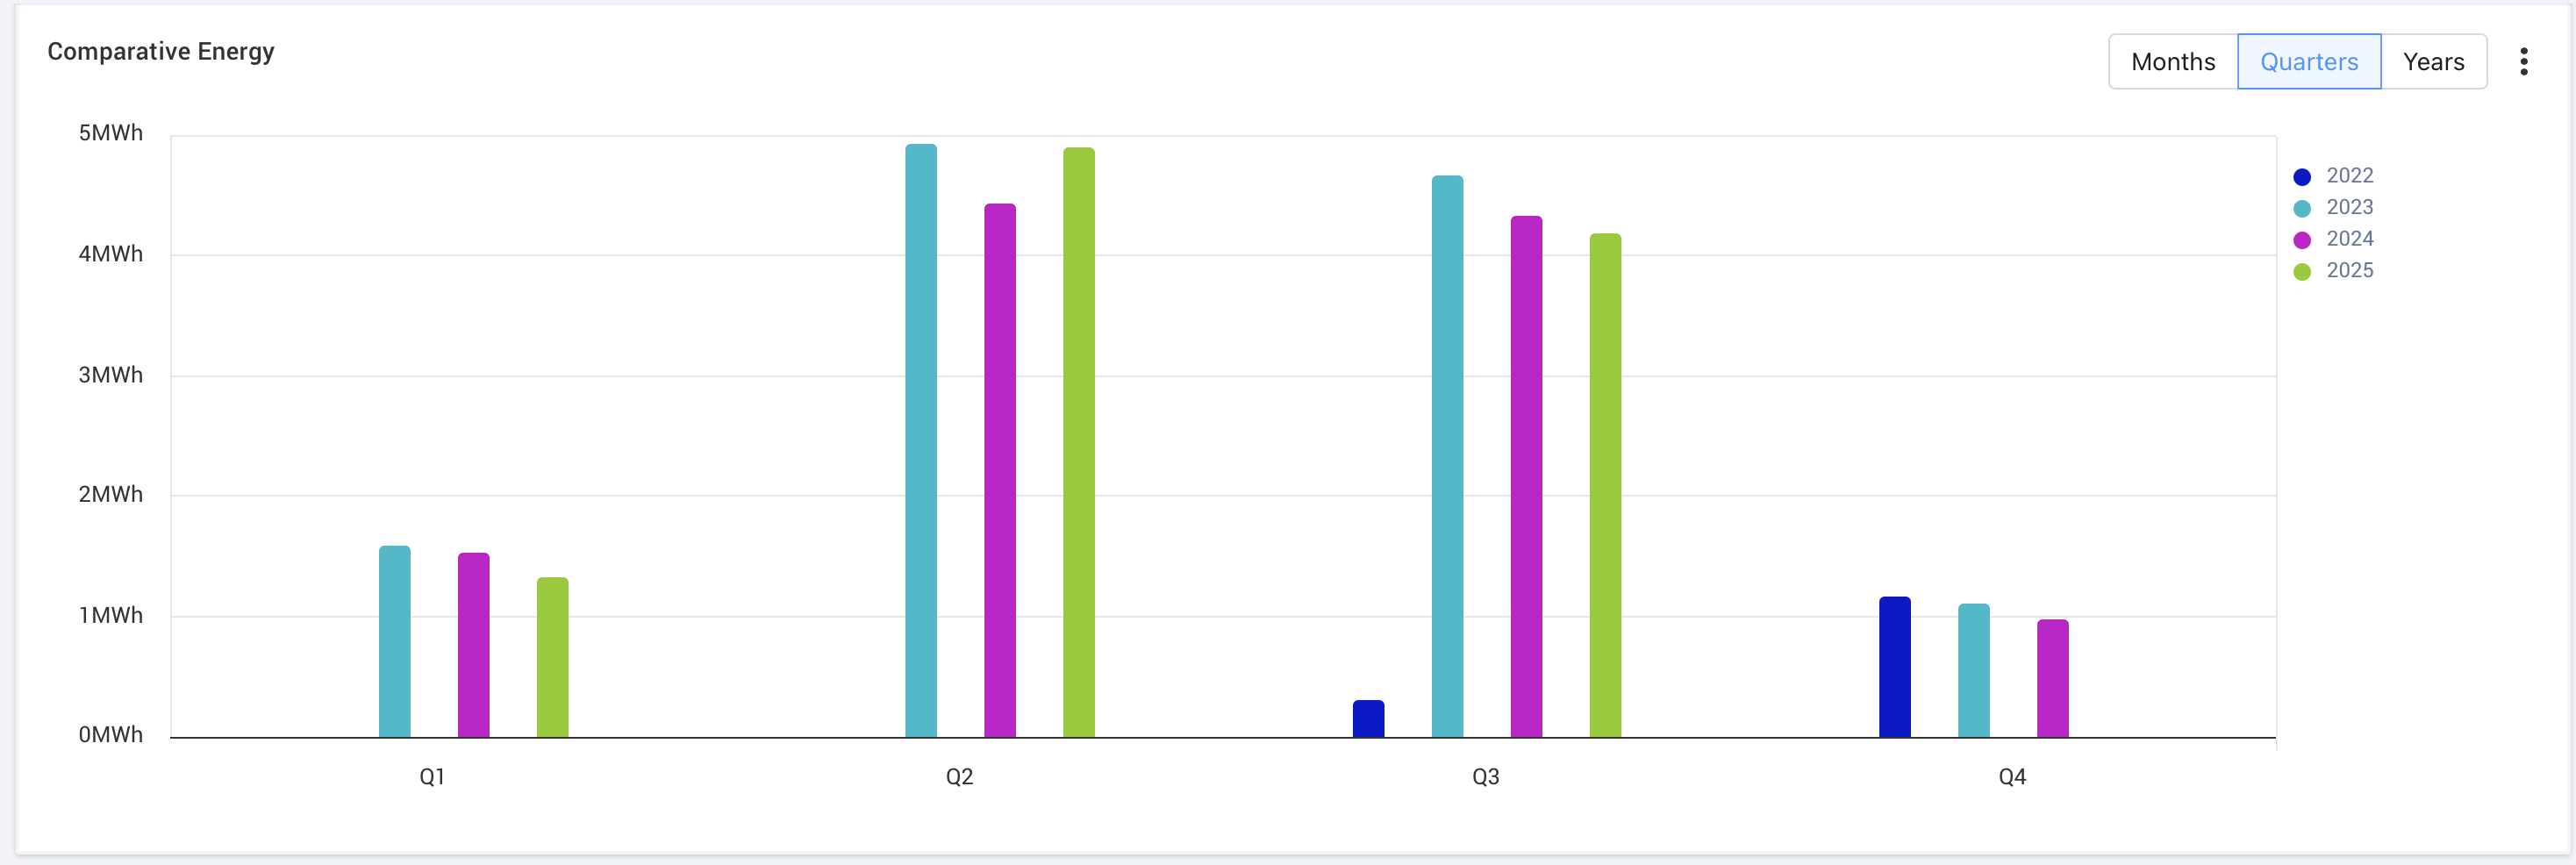
SolarEdge doesn’t provide a “past N days” graph, so you have to do some mental gymnastics. Looking at the monthly production, the first production year starts at the first September column, which is September 2022; goes to the end of the graph; wraps around to the left side of the graph in January 2023; and then ends in September 2023.
Just as in years one and two, July was the high production month.
Financial analysis
Electric bill reduction
My average electricity cost in the past 365 days was $0.135/kWh. That’s my estimate from the bills.
The SolarEdge inverter says my system generated 11.26 MWh. Some of that offset my current electric bills and some was banked for future savings as part of 1:1 net metering.
If I count the value of the banked kWh, which will offset my next one or two electric bills, then it generated $1,520 in savings over the past year. I think this is correct because the offset savings will occur soon and I’ll be careful to not double-count it next year.
So. Year one savings was $1,538. Year two savings was $1,472. Year three savings was $1,520.
ROI
I invested $28,568, net of the tax incentives. ($465 of that happened this year. I ought to apply some kind of time-value-of-money adjustment to it but I can’t be bothered.)
I got back ($1,538 + $1,472 + 1,520 = $4,530 ) in savings over three years.
That’s a 15.9% total ROI to date. That’s tax-free, with zero fees, and with very low risk.
So this system is a win from an ROI perspective. And because of the likely increase in savings with each passing year, the effective rate of return will increase with each year.
